点击蓝字 关注我们

欢迎各位专家学者在公众号平台报道最新研究工作,荐稿请联系小编Robert(微信ID:BrainX007); 或将稿件发送至lgl010@vip.163.com。
英文标题:Mesoporous vanadium-doped Fe3O4 nanozymes with enhanced peroxidase-mimetic activity for colorimetric/electrochemical dual mode detection of nitrite in food and seawater samples

成果简介
Fe3O4纳米酶因具有类过氧化物酶(POD)活性而引起了人们的广泛关注。与其他铁基纳米酶(如Fe2O3纳米酶和铁单原子纳米酶)相比,Fe3O4纳米酶具有成本低、制备工艺简单以及特殊的顺磁或超顺磁性等优点。Fe3O4纳米酶的活性部位来源于表面Fe3+和Fe2+的氧化还原循环,能够模拟几种天然氧化还原酶的活性。为了加速载流子转移和降低势垒,常采用了一些工程方法来调整Fe3O4纳米酶结构,包括价态(Fe3+/Fe2+比)、金属原子掺杂、表面配体和晶体结构。其中,过渡金属掺杂可以通过增加氧空位的数量来调整Fe3O4纳米酶的活性位置。钒(V)是一种具有多种价态(V3+、V4+和V5+)的过渡金属元素,可以参与氧化还原反应,模拟自然酶的活性。由于其离子半径与Fe3+相当,V的高价态(V5+)可以通过后掺杂的方法有效地结合到Fe3O4纳米酶的结构中,这种方法依赖于V5+和Fe3+之间的离子交换过程,而不改变Fe3O4纳米酶的原始形态。
双模传感技术可以通过集成两种信号(如光、电、热和磁信号)来实现分析物质的测定,双信号相互验证有利于提高分析精度。3, 3’, 5, 5’-四甲基联苯胺(TMB)作为评价纳米酶催化活性的常用底物,具有良好的比色和电化学响应,在开发双模式传感器方面显示出巨大的潜力。氧化态(TMB+)是纳米酶催化氧化反应生成的,在催化反应溶液中与TMB共存,直接与亚硝酸根(NO2−)发生重氮化反应,产生比色或电化学信号的变化。至于电化学传感模式,TMB和TMB+很难选择性地测定,而其总的电化学信号一般与NO2−浓度有关,故用电极测量TMB和TMB+的总电化学信号。
本工作采用简单的两步后掺杂法制备了介孔掺钒Fe3O4(V-Fe3O4)纳米酶,并基于V-Fe3O4的类过氧化氢活性和重氮化反应,研究了其在NO2−比色/电化学双模传感中的分析应用。V元素的掺杂可以增加V-Fe3O4纳米酶的缺陷结构(如氧空位),加速载体转移,从而提高POD模拟催化活性。结合密度泛函理论(DFT)计算数据和实验结果,研究了V-Fe3O4纳米酶的结构与催化活性的关系。TMB作为一种双功能信号源,可被V-Fe3O4纳米酶氧化成蓝色的TMB+,与靶标NO2−发生特定的重氮化反应,产生TMB+的色度/电化学信号变化。通过采集652 nm(TMB+)和445 nm(重氮化TMB+)的吸光度比,得到了一种用于检测NO2−的比色传感器。与比色分析中使用的传统终止剂(如硫酸)相比,V-Fe3O4纳米酶具有强大的磁性分离能力,提供了一种更高效、更方便的终止方法。利用二氧化硅纳米通道薄膜修饰的氧化铟锡(SNF/ITO),通过选择性灵敏测定带正电荷的TMB+,建立了一种检测NO2−的电化学传感器。比色法中的比率信号,以及电化学法中SNF的静电富集和分子筛分能力,实现了食品和海水样品中二氧化氮含量的精确双模式测定。需要注意的是,V-Fe3O4纳米酶的后掺杂合成具有成熟的Fe3O4纳米酶材料合成方法、简单的掺杂过程和低廉的试剂成本,有望在工艺工程和优化后实现规模化生产,以确保产品的一致性。本传感器为设计高性能纳米酶和构建高灵敏度双模传感器提供了一种新策略,在食品安全监管和环境监测方面具有巨大潜力。
研究亮点
高类酶活性:通过后掺杂法成功合成了具有高活性位点的介孔V掺杂Fe3O4纳米酶,DFT数据表明,V掺杂提高了V-Fe3O4纳米酶的POD活性,主要由于氧空位的增加和对H2O2吸附能力的提高。
双模式传感:构建了基于V-Fe3O4纳米酶的比色/电化学双模式传感器,用于定量分析食品和海水样品中的亚硝酸盐(NO2−),双模式传感器在食品和海水样品中表现出高灵敏度和选择性,检测限分别为2.22 μM(比色法)和18.8 nM(电化学法)。
多功能应用:可以结合侧流检测、纸基微流控或智能手机等技术,具有广泛的应用潜力;在食品安全和环境监测中具有巨大应用前景。
图文解析

Fig. 1. (A) Schematic representation of the synthesis of V-Fe3O4 nanozymes. SEM (B) and TEM (C–D) images of V-Fe3O4 nanozymes. (E) Nitrogen adsorp-tion–desorption isotherm of the V-Fe3O4 nanozymes. The inset shows the calculated pore size distribution curve of the V-Fe3O4 nanozymes from the adsorption curve. (F) EDS elemental mapping of V-Fe3O4 nanozymes, O, Fe, and V. (G-H) HR-TEM images of V-Fe3O4 nanozymes. The highlighted regions by yellow circles refer to the localized lattice disorder. (I) Magnetization curves of the Fe3O4 nanozymes and V-Fe3O4 nanozymes. The inset is the photographs of V-Fe3O4 nanozymes in the absence (left) and presence (right) of magnet. (For interpretation of the references to color in this ffgure legend, the reader is referred to the web version of this article.)

Fig. 2. XRD patterns (A) and FT-IR spectra (B) of Fe3O4 nanozymes and V-Fe3O4 nanozymes. The inset is the ampliffed XRD patterns. (C) V 2p XPS spectra of V-Fe3O4 nanozymes. Fe 2p (D) and O 1s (E) XPS spectra of Fe3O4 nanozymes and V-Fe3O4 nanozymes. (F) Zeta potential of Fe3O4 nanozymes and V-Fe3O4 nanozymes.

Fig. 3. (A) UV–vis absorption spectra of TMB/H2O2 with various catalysts. (B) UV–vis absorption spectra of different system. The concentrations of TMB, H2O2 and V-Fe3O4 nanozymes are 0.2 mM, 0.1 mM and 10 μg/mL. The reaction time is 30 min. (C) UV–vis adsorption spectra of TMB/H2O2 with V-Fe3O4 nanozymes synthesizedby various mass ratios of Fe3O4 and VCl3 (5:1, 3:1, 1:1, 1:3, and 1:5). (D-E) Kinetic assays of V-Fe3O4 nanozymes. Michaelis-Menten curves and the correspondingLineweaver-Burk plots for TMB and H2O2 of V-Fe3O4 nanozymes. The concentration of V-Fe3O4 nanozymes was 30 μg/L. The concentration of H2O2 was ffxed as 0.1 mM and the TMB concentration was varied in (D). The concentration of TMB was ffxed as 0.2 mM and the H2O2 concentration was varied in (E). (F) EPR signals of DMPO-O2•-, DMPO-•OH and TEMP-1O2 adducts in the presence of V-Fe3O4 nanozymes and 0.1 M H2O2. (G-H) Structure models and corresponding relative adsorption energies of H2O2 adsorbed at different sites: Fe site of Fe3O4 nanozymes, Fe and V sites of V-Fe3O4 nanozymes. (I) Schematic illustration of reaction process of H2O2 on V-Fe3O4 nanozymes. (J) Free energy diagrams of Fe site of Fe3O4 nanozymes, Fe and V sites of V-Fe3O4 nanozymes in the reaction Process. (K) The schematic diagram of POD-like catalysis of V-Fe3O4 nanozymes.
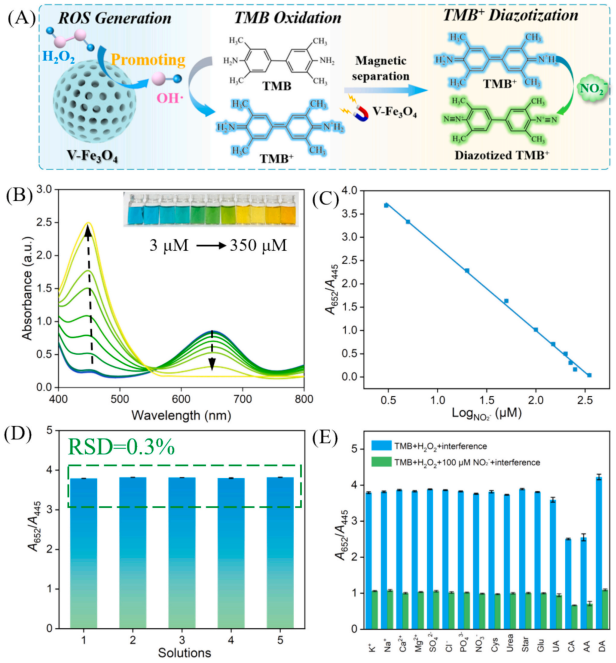
Fig. 4. (A) Schematic illustration of oxidation of TMB catalyzed by V-Fe3O4 nanozymes and detection mechanism for NO2− based on the diazotization reaction between TMB+ and NO2− (B) UV–vis spectra of the TMB/H2O2/V-Fe3O4 system with various concentrations of NO2− ranging from 3 μM to 350 μM. Insets are the corresponding photographs. (C) Calibration curve correlating the absorbance ratio (A652/A445) to the logarithm of NO2− concentration. (D) A652/A445 values of ffve parallel TMB/H2O2/V-Fe3O4 solutions obtained from UV–vis spectra. (E) The selectivity and anti-interference ability of TMB/H2O2/V-Fe3O4 system with various interferences. The concentrations of K+, Na+, Ca2+, Mg2+, SO42− , Cl− , Star, and Glu are 1 mM. The concentrations of PO43− , NO3− , Cys, Urea, UA, CA, AA and DA are 1 μM. The concentrations of TMB, H2O2 and V-Fe3O4 nanozymes in (B-E) are 0.2 mM, 0.1 mM and 40 mg/L. The reaction time is 10 min.

Fig. 5. (A) Schematic illustration of electrochemical detection of NO2− based on the SNF/ITO electrode and TMB/H2O2/V-Fe3O4 system. (B) DPV curves obtained on the SNF/ITO electrode after electrostatic enrichment of TMB+ in NaAc (0.2 M, pH 4.0) solution containing various concentrations of NO2− . (C) Calibration curves of the ΔI at 0.31 V with the NO2− concentration. Inset is the ampliffed calibration curve in the low linear range. (D) Renewability of SNF/ITO electrodes. Anodic peak currents obtained at the SNF/ITO electrode after successive incubation with reaction solution (top) and 0.2 M NaAc solution (bottom). The concentration of NO2− is 100 μM. (E) Inffuence of colored samples on the electrochemical and colorimetric detection of NO2−. Simulated colored samples are prepared without (I) or with the addition of methyl violet (II), riboffavin (III), congo red (IV) or Fe(III)-Phen (V) to the NaAc solution, whose photographs are shown in the inset. I0 and I denote the anodic peak currents in the buffer and simulated colored samples, respectively. A0 and A denote the absorbance in the buffer and simulated color samples, respectively. The concentrations of TMB, H2O2 and V-Fe3O4 nanozymes in (B-E) are 0.2 mM, 0.1 mM and 40 mg/L, respectively. The reaction time and enrichment time are 10 min. (For interpretation of the references to color in this ffgure legend, the reader is referred to the web version of this article.)
Table 1. Detection results of NO2− content in actual samples by ratiometric colorimetric mode.
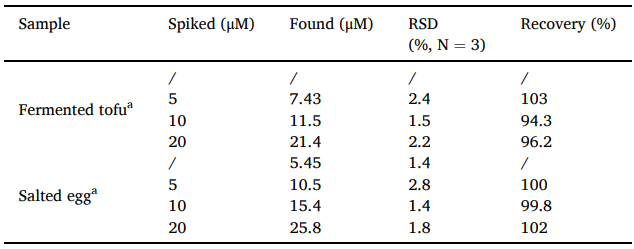
Table 2. Detection results of NO2− content in real samples by electrochemical mode.

研究结论
本研究通过后掺杂策略成功制备了具有高效POD活性的V-Fe3O4纳米材料,并构建了一种新型比色/电化学双模式传感器,用于定量分析NO2−。由于掺杂了 V,V-Fe3O4 纳米材料对 H2O2 的吸附能力增强,电子传递加速,从而具有优异的 POD 模拟性能。无色 TMB 可作为双功能信号报告物:(I) 作为显色底物被 V-Fe3O4 纳米酶氧化成蓝色 TMB+;(II) 作为氧化还原分子进行电化学反应。通过监测催化反应过程中TMB+(652 nm)和重氮化TMB+(445 nm)之间的动态吸光度比值,实现了比色法检测。电化学检测采用的 SNF/ITO 电极兼具分子选择性和防污特性,可通过选择性静电预浓缩TMB+,灵敏地测定 NO2−。这种双信号验证方法利用了比色法和电化学信号的自校准特性,确保在包括食品和海水样品在内的复杂基质中准确检测出 NO2−。这项工作不仅通过缺陷工程推进了纳米酶的设计,还为在各种场景下开发多模式传感器建立了一种通用方法。提出的比色/电化学双模式传感器可与横向流动检测、纸质微流体技术或智能手机相结合,在食品安全保障和海洋环境监测应用中展现出巨大潜力。
免责声明:原创仅代表原创编译,水平有限,仅供学术交流,如有侵权,请联系删除,文献解读如有疏漏之处,我们深表歉意。


公众号丨智能传感与脑机接口